The Executive’s Guide to Better Performance in Commercial Printing

TL;DR
TL;DR: This guide shows printing-company leaders how to improve profits and competitiveness by measuring four KPIs—proof turnaround, on-time delivery, shipping accuracy, and customer satisfaction—and fixing the weakest links. Following a 90-day benchmark→pilot→scale plan with clear targets (e.g., 24–48h proofs, 95% on-time, 98–99% accuracy, NPS 50+) can lead to higher profits, increased company value, and the ability to charge premium prices.
A simple guide that helps business leaders use key numbers to improve their printing companies and beat the competition.
TD:LR
Too many printers are stuck fighting over pennies—nearly half lost money last year—when the real game is operational excellence. By systematically measuring your proof turnaround, delivery reliability, shipping accuracy, and customer satisfaction, you can transform a shrinking 2 percent margin into a double-digit growth story. In just ninety days, one month to benchmark, one to pilot improvements, and one to scale—you’ll unlock higher profits, happier clients, and the power to command premium rates. Start tracking today and join the select few who aren’t just surviving the digital printing boom but leading it.
What if small improvements in four key areas could make your business much more profitable?
Here’s the truth about commercial printing today: 61% of printing companies grew their sales last year, and 22% had robust growth. But here’s the problem – 40.8% of these same companies made less profit even though they sold more.
The difference between companies that thrive and companies that struggle isn’t about luck or market conditions. It’s about measuring the right things and making them better.
This guide outlines four key performance indicators (KPIs) that successful printing companies track. When you improve these numbers, your entire business improves. You’ll learn exactly what to measure, what targets to hit, and how to get there in 90 days.
What You’ll Get:
- Simple targets based on what the best companies achieve
- Easy ways to calculate if improvements will make you money
- Real examples of how this works
- A step-by-step plan to get started
Our Promise: Turn your printing business from one that always puts out fires into a smooth-running operation that customers love and competitors can’t match.
Why It Matters
Most printing company owners work incredibly hard but don’t know if they’re working on the right things. Without measuring key performance areas, you’re flying blind. This guide provides you with a clear dashboard for your business, much like pilots use instruments to fly safely through clouds.
How Your Company Compares to Others
Based on data from PRINTING United Alliance and research companies, printing companies fall into three groups:
Company Performance Levels
Top Performers (95%+ in key areas):
- Can charge higher prices because customers trust them
- Make 2% more profit than average companies
- These are the 22% of companies with double-digit growth
Middle Performers (90-95%):
- Competitive but struggles when times get tough
- Vulnerable when something goes wrong
Bottom Performers (Less than 90%):
- Customers see them as cheap options only
- Among the 40.8% losing money despite higher sales
The Money Difference
Companies that move from middle to top performance can increase their company value by 50% in just 12 to 18 months. The profit improvement from each level provides business owners with clear reasons to invest in improvement.
Real Example: A $15 million printing company improved from 91% average performance to 96% in one year. Results: The Company became worth 50% more, customers stayed 35% longer, and it was acquired by a larger company that recognized its excellent operations.
Why It Matters
Knowing where you stand compared to others shows you what’s possible. If you’re in the bottom group, you’re likely competing mainly on price, which can be exhausting and unprofitable. Moving up even one level means you can charge more, keep customers longer, and sleep better at night knowing your business is stable.
The Four Key Numbers That Matter Most
The best printing companies know these four numbers don’t work alone. When you improve one, it helps improve the others, creating a decisive advantage.
Number 1: How Fast You Create Proofs (Target: 24-48 Hours)
What This Means: How quickly do you show customers what their job will look like before you print it?
Target to Hit: 95% of proofs ready in 24 hours; 99% ready in 48 hours
Real Example
A regional printing company set up automatic proof systems. They promised 24-hour proofs and won a $3 million sports marketing contract because the customer trusted they’d be reliable.
Financial Impact: Automated proof systems typically pay for themselves within 8-12 months through increased productivity and lower labor costs.
How This Connects: Faster proofs lead to more efficient production scheduling, enabling you to deliver jobs on time.
Proof Timeline: From Customer Submission to Approval
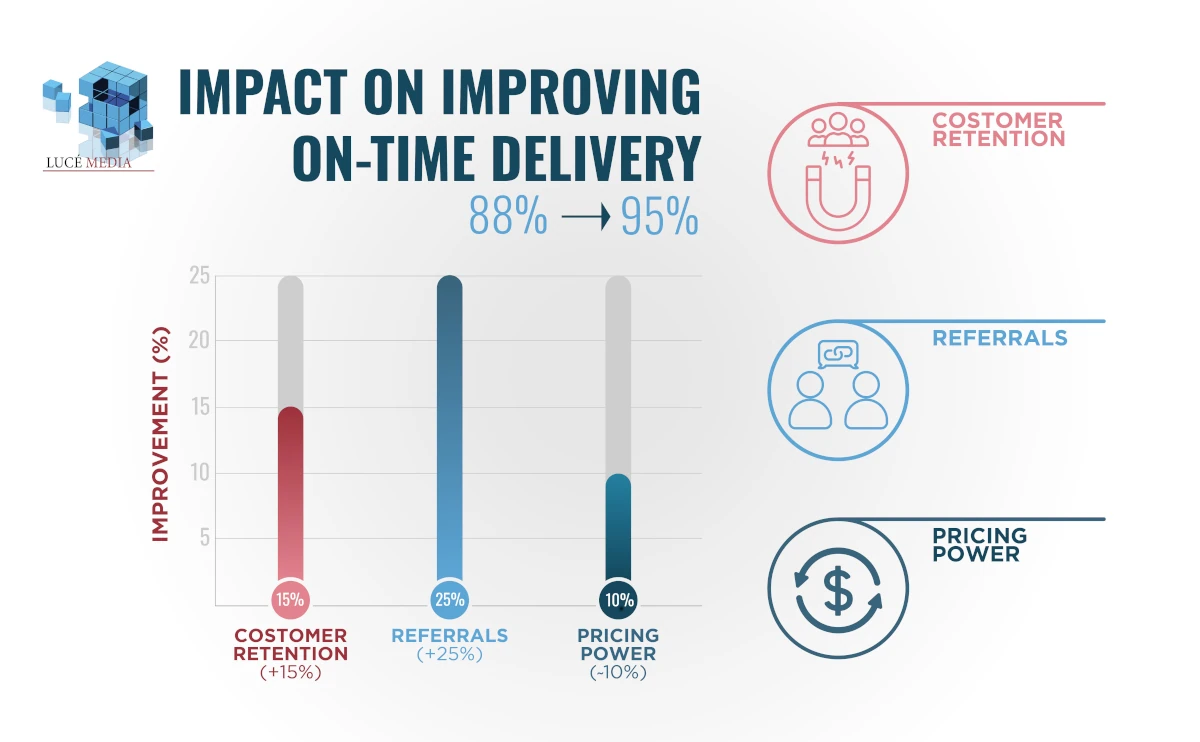
Number 2: Delivering Jobs On Time (Target: 95%)
What This Means: How often do you deliver jobs when you promised them?
Target to Hit: 95% of jobs delivered on the promised date; 98% within one business day
Smart Strategy: Identify your top 20% of customers (they likely generate 60-80% of your profit) and reserve space for them during busy periods.
How This Connects: When proofs are faster, you can schedule production more effectively, resulting in fewer late deliveries.
Important: Many mid-sized companies achieve 95% on-time delivery by optimizing their workflow, not by purchasing expensive new equipment.
Number 3: Shipping the Right Stuff (Target: 98-99%)
What This Means: How often do customers get exactly what they ordered, delivered to the right place?
Target to Hit: 98-99% accuracy is what the best companies achieve
Money Saved: Each 1% improvement typically saves $15,000 to $25,000 per year in reprinting costs and rush shipping for medium-sized companies.
Team Building: Create “Employee of the Month” programs based on accuracy. When workers compete to be most accurate, everyone wins.
How This Connects: Accurate shipping makes customers happier, which in turn leads to higher satisfaction scores and more referrals.
Number 4: Happy Customers (Target: Score of 50+)
What This Means: How likely customers are to recommend you to others, measured by Net Promoter Score (NPS).
Target to Hit: Scores above 50 are excellent across all industries
Financial Impact: Every 10-point improvement typically results in a 12-15% higher customer lifetime value and 20-25% more referrals.
How to Measure: Ask customers: “How likely are you to recommend us to a friend or colleague?” Rate 0-10. Then ask what you could do better.
How This Connects: Happy customers come from the other three numbers working well – fast proofs, on-time delivery, and accurate shipping.
Why It Matters
These four numbers provide a comprehensive view of your business’s health. It’s like checking your blood pressure, weight, heart rate, and temperature at the doctor’s office – each one tells you something important, but together they reveal whether you’re healthy or need help. Most printing companies only track sales and basic costs, missing the operational health indicators that predict future success.
The Four Stages of Business Performance

The Four Stages of Business Performance Evolution
Printing companies grow through four stages of how well they track and improve performance:
Stage 1 – Always Reacting (Usually 85-89% Performance)
- Track numbers by hand in spreadsheets
- Always dealing with problems after they happen
- Can’t see patterns or predict issues
Stage 2 – Being Proactive (Usually 90-94% Performance)
- Have standard ways to measure performance
- Use basic computer dashboards
- Review numbers weekly and fix problems
Stage 3 – Predicting Problems (Usually 95-97% Performance)
- Use math to predict when problems might happen
- Run scenarios for busy periods
- Match customer demand with production planning
Stage 4 – Automatic Optimization (Usually 98%+ Performance)
- Computer systems automatically schedule work for the best results
- Real-time adjustments based on current data
- Machines tell you when they need maintenance before breaking down
How Long and How Much
- Stage 1 to 2: 3-6 months, costs $25K-$50K
- Stage 2 to 3: 6-12 months, costs $75K-$150K
- Stage 3 to 4: 12-18 months, costs $200K+
Most successful companies get to Stage 3 before investing in Stage 4 technology.
Why It Matters
Navigating these stages is akin to learning to drive. First, you’re just trying not to crash (Stage 1); then you follow basic rules (Stage 2); then you start anticipating what other drivers will do (Stage 3); and finally, you drive so smoothly that it’s almost automatic (Stage 4). Each stage makes your business safer, more profitable, and easier to run.
Creating a Culture That Cares About Performance

Team Collaboration in Print Production Environment
Getting Your Team Involved
Monthly Team Meetings: Have production teams share what’s working to hit targets. Focus on solving problems together, not blaming individuals.
Recognition Programs: “Employee of the Month” and team rewards for hitting goals together. Celebrate quality and efficiency improvements, not just working fast.
Leadership Check-ins
- Weekly Quick Meetings: 15-minute reviews of key numbers
- Monthly Deep Dives: Figure out why numbers went up or down, and make plans
- Quarterly Big Picture: Compare to competitors and adjust targets
Avoid the Micromanagement Trap
Focus on coaching, transparency, and helping people improve processes. The goal is to produce excellent work, not to watch people constantly. Successful companies provide teams with data to enhance their performance.
Why It Matters
Culture eats strategy for breakfast. You can have the best systems and most precise targets in the world, but if your team doesn’t care about improving or feels like they’re being watched and judged, nothing will change. When people understand how their work affects customers and feel empowered to make improvements, they become your biggest asset in achieving excellent performance.
Your 90-Day Plan to Get Started
Month 1 (Days 1-30): Set Up the Foundation
- Week 1-2: Figure out your current performance in all four key areas
- Week 3: Get leadership team agreement on targets and success measures
- Week 4: Set up dashboards and start collecting clean data
Check Point: Dashboard working with 30 days of good data
Month 2 (Days 31-60): Test and Develop
- Week 5-6: Try new proof and delivery processes with some customers
- Week 7: Run team workshops and get everyone engaged
- Week 8: Research technology options and calculate return on investment
Check Point: Test results showing 2-3% improvement in targeted areas
Month 3 (Days 61-90): Full Implementation
- Week 9-10: Roll out to all customers and production lines
- Week 11: Review performance and refine processes
- Week 12: Test scenarios and plan for problems
Check Point: Achieve 90% of your first-year targets with sustainable processes
Problem Prevention
- Plans for supply chain disruptions that maintain 90%+ delivery
- Capacity planning for busy periods without compromising quality
- Backup procedures if technology fails
Why It Matters
A 90-day timeline compels you to achieve quick wins while building toward long-term success. It’s long enough to see real results but short enough to maintain momentum and urgency. Most importantly, it provides you with three clear checkpoints to ensure you’re on track and allows you to make adjustments as needed.
Preparing for the Future
AI and Automation
Nearly one-third of commercial printers want to invest in AI applications. Start with job scheduling optimization before expanding to predicting maintenance needs and customer demand.
Environmental Performance
More customers require sustainability reporting. Consider adding carbon-per-unit and waste-reduction targets to your key numbers. Many customers now require environmental performance as part of their vendor selection process.
Changing Customer Expectations
Digital printing is expected to account for 64.4% of output by 2026, up from its current share of 55.6%. Keep your measurement system flexible to handle shorter print runs and faster turnaround expectations.
Why It Matters
The printing industry is undergoing rapid change, and companies that can adapt will emerge as winners. By building strong performance measurement habits now, you’ll be ready for whatever changes come next. The businesses that survive and thrive are those that can quickly adapt to new customer needs while maintaining excellent service.
Time to Take Action
The commercial printing industry is undergoing rapid change. Digital printing is expected to account for the majority of output by 2026. Companies that systematically measure and improve their operations will capture the largest share of the market and generate the most revenue.
What to Do Right Now
- Check Your Current Performance: Use our simple evaluation to see how you compare to industry standards
- Plan Your Leadership Meeting: Get your management team aligned on performance targets and timeline
- Start Your 90-Day Plan: Begin by measuring baseline performance and finding quick wins
The question isn’t whether you should implement systematic performance management—it’s whether you’ll be a leader or follower in the industry’s transformation. The data is clear: companies that master operational excellence through disciplined measurement will thrive while others struggle.
Why It Matters
Every day you wait is another day that your competitors might gain an advantage. But the good news is that most printing companies aren’t doing this systematically yet, so you have a real opportunity to gain a significant advantage. The tools and strategies in this guide aren’t theoretical—they’re proven methods that successful companies use today. Your customers will notice the difference, your employees will take pride in their work, and your bank account will thank you.
Ready to transform your printing business? This guide gives you everything you need to achieve operational excellence. Your customers—and your profits—will thank you.
Need help implementing AI into your company or improving your marketing strategy? Reach out to us. With nearly one-third of commercial printers looking to invest in AI applications and the marketing landscape constantly evolving, getting expert guidance can accelerate your success and avoid costly mistakes.