What Are The Most Important Social Metrics For Twitter?
 I hear the debate all the time when looking at social metrics. Of course, I’m referring to the Twitter debate. Is Twitter still a good social platform for business? Should we consider Twitter to be a marketing tool, or is it just for people who have a lot of time on their hands and have a need to jibber-jabber all day long? Think of Twitter as a means to get instant public messages out to your audience, whether it is an audience of friends, colleagues, or potential customers.
Twitter is becoming an increasingly important platform for online communication and, yes, conversation. And where there is a conversation – there is opportunity and money. For example, the latest research shows 61% of customers’ purchasing habits are decided by those companies that deliver custom content. So content and Engagement are critical components of a successful Twitter strategy. But how and what you measure on Twitter concerning social metrics will point you in the right direction for executing a successful strategy.
By measuring how your audience responds to your Twitter presence, you’ll turn what seems like random interactions into an actionable strategy.
Every social media platform has its lexicon when naming features and taking action, and Twitter is no different. You can run month’s worth of reports, but they won’t mean a thing if you don’t have set goals and are trying to measure something you don’t understand.
To help you better navigate your Twitter metrics, here are some of the standard, most basic social metrics you should know about the platform.
- Direct Messages (DM): These are private messages sent from one Twitter user to another. They can be used for one-on-one conversations or between a group of users. Twitter’s 140-character limit no longer applies to DMs.
- Likes: This is used to represent a stand-out Tweet. The motivation behind clicking “like” is subjective, but it’s usually positive in sentiment. Likes replaced Favorites in 2015 and use a heart instead of a star icon. According to a Twitter product manager, this change was primarily due to the versatility of the heart. It meant to be a change towards something more universal that can be understood easily by new users.
- Followers: The number of people that currently subscribed to your updates.
- Mentions: Refers to a Tweet in which your @username is included.
- Replies: A response to a Tweet that begins with your @username.
- Retweets (RT): Occurs when a user shares an existing Tweet published by you (or another Twitter account) with their followers.
Get to Know Your Twitter Activity Dashboard
There is an activity dashboard available to any Twitter user who has signed up on the platform (or who has access to
Twitter Ads). The data displayed on your dashboard can help you optimize the effectiveness of your Tweets and inform you on what types of content you are creating for both paid and organic Tweets.
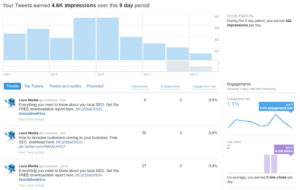
This activity dashboard will offer you some potentially valuable information. Here, you’ll see how people engage with your Tweets in real-time, and get a detailed view of the number of retweets, replies, likes, prompted follows, and clicks each of your Tweets receives. You can also get detailed insights into who’s your audience.
Your dashboard is separated into three main areas: Tweets, Audiences, and Events. These are the key metrics you will find here:
- Home Tab-Your Home screen provides a monthly at-a-glance summary of your Twitter highlights. This includes your:
- Top Tweet
- Top mention
- Top follower
- Top Media Tweets
- Tweets published: The number of Tweets you posted during a given period.
- Tweet Impressions: The number of people who saw your Tweet in their timeline or search results
- Profile Visits: The number of times your profile is visited as a result of a Tweet.
- Mentions: The tweets that mention your @username and received the highest number of any reactions or impressions. This does not have to be posted by the user; the user only needs to be tagged or mentioned.
- New Followers: The number of people who weren’t previously subscribed to your Tweets and now are. If you lost followers, this would be a negative number.
- Tweets linking to you: The number of Tweets that a user’s Twitter Card(s) gives a summary of a website or video through an image tweeted by the user or others.
Under the tab labeled Tweets – these are the most important metrics to track:
- Engagement: This is a user’s interaction with your Tweets. It includes mentions, replies, retweets, likes, line clicks, and new followers.
- Tweet Impressions: This directly relates to the number of followers, mentions, and retweets that a user receives. How many streams a tweet is added to.
- Engagement Rate: The number of engagements or clicks on the tweet, including likes, retweets, and follows, divided by impressions.
We should point out that this “Tweet” tab focuses solely on Tweets that you’ve created (including replies you’ve sent) and doesn’t include any Tweets that mention you.
Audiences Insights Tab
The more information you have about your audience, the more compelling content you can create. The Audience Insights tab helps you discover valuable information about your followers and the people who’ve engaged with your Tweets. Here you’ll have access to data about:
- Demographics: Such as gender, language, origin, gender, income, marital status, education, and more.
- Interests: A real-time interest graph displays what percentage of your audience are interested in specific topics, ranging from technology and entertainment to business and tech news
- Lifestyle: Identifies the occupation, TV viewing preferences, and political affiliation of your audience.
- Purchasing behavior: Breaks down your audience’s buying style and the types of consumer goods they favor.
- Mobile footprint: Informs you about which wireless carrier and device your audience is using.
Twitter Metrics Reports to Run
- The Profiles Report
Your Twitter Profiles report will help you see how your audience is interacting with your content. From this report, you can build an engagement strategy that’s relevant to customers and drives performance.
- The Twitter Comparison Report
The Twitter Comparison report is a way to gain insight into how your Twitter strategy stacks up against your competitors. Through this report, you receive a breakdown of your engagement, influence, follower growth, and mentions—and then compare that to one of your competitors to see where your strategy can be improved.
- The Twitter Listening Report

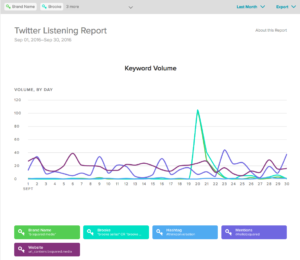
With the Twitter Listening report, you can better understand the effectiveness of your Twitter campaigns and uncover trends in the usage of brand keywords and hashtags.
Put Your Best Foot Forward
Content is a massive piece of your social media marketing strategy. However, creating powerful content that delivers results requires actionable data. When paid attention to, your Twitter metrics can significantly impact what you get out of the social network.
While there’s no right or wrong way to track your performance on Twitter, using these basic tools can help your efforts on Twitter become more productive with your reporting and social metrics.
But are These Metrics Enough to Grow Your Business?
Over 500 million messages are posted every day on Twitter. How many mentions your business? What about your company? This might be a good time to find out. The metrics described above are the most basic metrics offered by Twitter. But in a world where deep data can make or break many marketing campaigns – new metrics and new measurement methods have proven very successful. At Lucé Media, we offer a product called ShareRocket that provides an intense dive into social media metrics of all types.
Our social media metrics tools will allow you to manage your entire social footprint with the social metrics that matter. Our SHARE and SEI® metrics are simple to understand, yet robust social metrics that change the culture and improve the performance of your entire organization. Strong metrics guaranteed to move your business forward.
We have created the industry’s best real-time metrics to manage every level of your brand’s social presence. Look at your performance on Facebook, Twitter, and Instagram at a glance. Then, dive deep into our dashboards and reports for actionable insights.
Lucé Media customers see dramatic growth over their competitors using standard analytics tools like those we have described in this article. Grow your Engagement and expand your revenue opportunities. Clients using Share Rocket see up to 150% more Engagement than using standard analytics tools.


