Average Time Spent Daily On Social Media
In 2022, social media is one of the best ways for people to connect with one another.
It not only allows people to stay in touch across continents and time zones but also with friends who live just a few houses down. We’re connected today in ways previous generations couldn’t even have dreamed about.
But with that constant connection comes this question: How much time do people spend on social media each day? Is it too much? Should we be embracing our increasingly connected lives, or making an effort to cut back on screen time? The answer to that question is up to each person to make for themselves, but first, they need to know the numbers.
Read on to see how much time people actually spend on social media in 2020.
Why Social Media Statistics Matter
Like it or not, social media is a huge part of people’s live now, and that doesn’t seem to be about to change any time soon.
Every day, the number of social media users increases. Every second, 11 people use social media for the first time. In 2017, less than 2.5 billion people were on social media worldwide.
Today, in 2021, some 3.8 billion people use social media, which is more than half the world’s population.
As we consider the role social media plays in our lives today and into the future, we’ll have to decide whether we want to continue to allow this technology to take up as much of our time as it does today, or if it’s time to pump the breaks on the constant mobile connectedness.
Average Daily Time Spent on Social Media Around The World
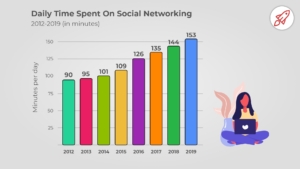
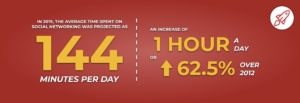
On average, we spend 144 minutes, or two hours and twenty-four minutes, on social media but this number is just that – an average. In some places in the world, people spend far more time on social media, and in others they spend far less.
Studying this helps us get a better understanding of how impactful social media is in the lives of people in some societies versus others.
By continent, here’s a breakdown:
- North America: 2 hrs 6 min
- South America: 3 hrs 24 min
- Africa: 3 hrs 10 min
- Europe: 1 hr 15 min
- Asia/Oceania: 2 hrs 16 min
Additionally, the time people spend on social media each day has been growing since 2012. There’s no way to predict the future, but we expect that in 2020 and beyond, the global average will likely rise, especially since the number of internet and social media users around the world continues to grow.
Time Spent on Social Media in a Lifetime
In 2021, the World Health Organization estimates the average global lifespan is 72 years, and if we assume that many people now start using social media as young as 10 years old, that means the average person will spend a total of 3,462,390 minutes using social media over their whole lifetime.
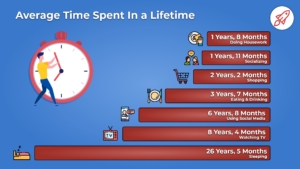
In other words, that’s nearly 6 years and 8 months on social media in their lifetime based on the projections for social media use in 2020. Obviously, usage will likely change within the next seven decades, so take that number with a grain of salt. But since the trend over the past few years has been for people to spend more and more time on social media, that means humans are on track to spend a decade or more time on social media in their lifetime.
For comparison, Bureau of Labor Statistics data shows that people spend more time on social media than on some everyday activities.
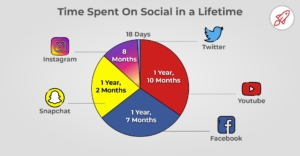
If we break these numbers down even further, we can get a sense of how much time we are spending on each individual network and how that adds up across our lifetime.
From that data, we can quantify approximately how much time the average person will spend on each individual network throughout their life.
This is just a projection and doesn’t include every possible social media channel. It’s also assuming that social media channels and usage will stay the same throughout someone’s entire life – unlikely!
But, we do know a lot about each social media channel today and how many people are using it in aggregate and on a daily basis.
Here’s a quick snapshot of 8 most popular social channels today:
Daily Time Spent on Facebook
Social media companies don’t generally release information about how much time people spend using them daily, however studies have been done on daily social media use, and Facebook reigns supreme when it comes to time spent within the platform; 58 minutes per day on average, according to a study by SimilarWeb.
Facebook is clearly still the top dog of social networks, despite headlines saying young people are abandoning the 15-year-old platform. The data shows otherwise; in 2019, 59 percent of all Facebook users were between 18 and 34 years old.
Facebook still has 1.4 billion active users every day, who upload 300 million photos and watch 8 billion videos daily.
Average Daily Time on YouTube
Close behind Facebook is YouTube, where people watch 5 billion videos daily. YouTube’s 30 million daily active users are nowhere close to Facebook’s 1.4 billion, but YouTube’s big advantage is that its average visitor spends 40 minutes on the site at a time.
Daily Time Spent on Instagram
Coming in third for social network popularity is Instagram, which is owned by Facebook. Instagram sees 500 million daily active users, who upload 95 million photos and 250 million stories each day. SimilarWeb found users spent an average of 53 minutes per day on Instagram in 2018.
Average Daily Time on Whatsapp
Whatsapp, also owned by Facebook, sees 320 million daily active users who send 43 billion messages daily on the platform, spending an average of 28 minutes in the app daily. What lands Whatsapp in the #4 spot for social media popularity is the face that it’s adding a million new users every day.
Daily Time Spent on Twitter
Twitter has 100 million daily active users who post 140 million tweets daily. Twitter is also adding 460,000 new accounts each day, on top of its current total of 1.3 billion registered users.
Average Daily Time on Snapchat
Snapchat has 178 million daily average users who create 3 billion snaps daily. According to SimilarWeb, the average Snapchat user spends 49.5 minutes per day in the app. Snapchat also logs 10 billion daily views of videos posted on its platform. 60 percent of Snapchat’s users are between the ages of 18 and 34, and users under 25 are spending the most time on Snapchat out of all its users. It’s definitely a network that’s popular with the younger set.
Daily Time Spent on LinkedIn
Though it’s the oldest social media network on the list, LinkedIn’s professional image has kept it’s user base from growing as quickly as some other platforms. Still, its 546 million daily active users are nothing to sneeze at. And LinkedIn is adding more than 5 million new accounts each month, about two every second.
Average Daily Time on Pinterest
Pinterest sees 70 million daily active users, including 2 million daily users who actively save pins to their boards, spending an average of 14.2 minutes on the site per visit. More than 100 billion pins have been saved to more than 1 billion boards in Pinterest’s nine years and the network is a powerful driver for traffic to content on other sites.
Social Media Changes in 2020
As 2020 continues to unfold, the social media landscape will only continue to change. Reports show the way upcoming generations use social media is vastly different, so the way people use social media today may not be a great indication of the way they’ll use it in the future.
Hill Holliday’s independent consumer and business insights research group, ORIGIN, released a study last year that looked at the ways Gen Z (people born after 1994) use social networks. Based on their findings, the trend that sees social media use increasing year-after-year may not continue much further into the future.
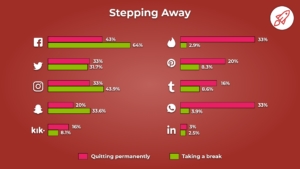
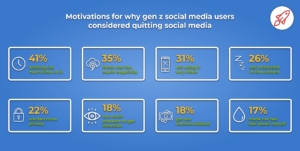
ORIGIN’s study found that 64 percent of Gen-Zers had taken a break from one or more social networks. 34 percent had completely quit social media.
The majority of Gen-Zers reported they were stepping back from social media because they felt they wasted too much time using it, but negativity in the content, privacy concerns and commercialization were also huge factors.
If Gen Z’s trends continue in future generations, social media may actually play less of a role in people’s lives than it does today. It’s odd to think that mega-platforms like Facebook and Instagram may be hitting their peak, but the data shows that could be the case.
The most important takeaway from any set of social media statistics like these is that the social landscape is changing, constantly and rapidly. In 2020, people spend a lot of their time on social media. That will likely still be the case in 2021 and 2022, and beyond but as we become more and more screen saturated, this trend of spending more and more time on social media might slow down and eventually reverse.
However, no matter how you feel about social media, the numbers show it’s a huge part of our lives, at least for now.
Blog originally seen on Broadband Search


