Key Internet Statistics In 2022 – The State of Cyberspace
The internet is vast, vital to most of our lives, and growing at a rate only a few of us could dream of 30 years ago. There are a few topics that are more worth your time to understand. The benefit of learning more is it can improve your home life or your business. It can simply allow you to get more enjoyment out of your time each day. Whether you are a tech professional or the average person, there is so much to learn. Something new is happening every day.
Yet how should you study the internet? Through what lens should you look at it? You can use examples and anecdotes. They help you if you’re curious about whether something can be done. Yet they leave an incomplete picture. Yet with billions of users (and growing) only large-scale statistics can get to the heart of many questions. Data is the best predictor for at least mainstream trends. For your improved understanding of this interesting and developing world, we’ve decided to provide you with plenty of information on the subject.
Here are all the statistics you should be aware of regarding the internet going into 2022. We’ve divided them into five major categories:
General Internet Statistics
While deeper topics are explored later in the piece, it’s important to understand how the pillars and the user base of online life look in 2022. Here are some general statistics and pieces of information to give you a better understanding of modern cyberspace:
Population and Usage
- As of the most recent count, there were more than 5.16 billion internet users worldwide. That is more than half of the population of the world, children too young to use are included.
- Some companies and ventures are interested in lower-cost satellite internet (there are options currently, but comparably they are expensive and inaccessible), which would vastly and rapidly increase this number, assuming people could have cheap access to internet-enabled devices.
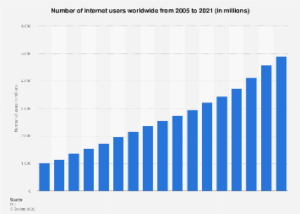
- About 6 percent of the world’s population had internet access as of March 2021. This is a huge amount of growth considering that in 1995 only 0.4 percent of the population had access (about 16 million people) and that in June 2010 that number was 28.7 percent.
Here’s a more in-depth chart displaying that growth:
- Whether we’ll see a huge amount of growth as we’ve seen before or a temporary slowdown before another push is yet to be seen
- 81 percent of adults in the United States use the internet daily, according to the Pew Research Center. They also note that only 10 percent of adults never use the internet at all. Increased smartphone proliferation is likely responsible, at least in part, for this rate.
- Also according to the Pew Research Center, more people are online constantly. A somewhat surprising 28 percent of adults qualify for that distinction, and nearly half of those people are ages 18-29. We will have to wait and see whether this continues at the same rate for younger users, continues at the same rate, or whether there’s a backlash against such heavy usage.
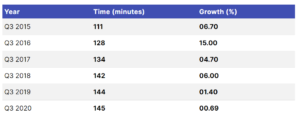
- The average person spends nearly six and a half hours online or with digital media every day. That number is growing every year. People aren’t spending any more time on their desktops than before. They are spending more time on mobile devices and a bit more time on other connected devices. The internet is changing shape, so you’ll be able to see other things as well, the lines between online life and normal life are blurring.
- This means that the average person is spending more than a quarter of their life online. They are probably more than a third of their waking hours online. Some people, naturally, are spending much more than that. While concepts such as internet addiction have been mentioned before, we wonder how society will adapt and respond to some of the potential negatives of this change.
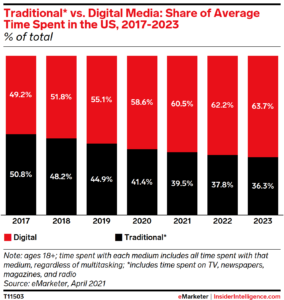
- As of 2021, about 60.5 percent of all time spent with media was spent with digital media.
Size and Scope
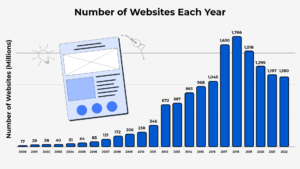
- There are more than 92 billion websites that are online right now. We would like to note that this number is somewhat fluid and imprecise given the scale. Ultimately, it’s a demonstration of how much content is available.
- We also cannot be certain of how much of the content referenced above is effectively randomly generated or useless to nearly everyone. Even then the use of such generation is a display of large-scale movements at work.
- As of 2022, there were 3 million registered domain names. Not all of them are used. Some might be used by the same company or website. Yet there is more than enough content online to last lifetimes. Furthermore, more content is generated every second.
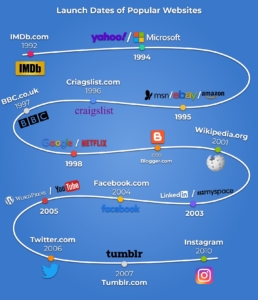
The internet as we know it is getting close to 30 years old. More people than not have grown up without the internet, and certainly without the internet as we know it today. To put things into perspective, consider the following popular websites.
- This is just a small sampling. There are many more potential examples. Many more of these sites only grew in scope over a short period (some social media sites took a while to take off).
- There are just as many sites that took off, declined, and are now either effectively dead or a shell of their former selves. It’s not just new sites constantly being built, it’s new sites and pages being built that also exceed the number of defunct pages.
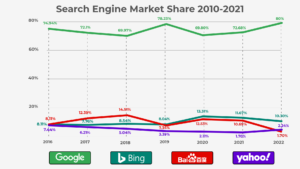
- There are, as of the time of this writing, about 100,000 Google searches made every second, and the number is rising. You can expect there to be several trillion searches made in 2022. The average person makes several a day, and isn’t it likely you found this page through a Google search?
- According to NetMarketShare, Google was responsible for 80 percent of desktop and laptop search traffic in January of 2022.
The mobile search traffic statistics are even more dominant for Google, with them being responsible for 93.96 percent of traffic. This can easily be attributed to Android’s dominance as a mobile OS (and effectively the only OS outside of Apple products).
- There could be several reasons, benevolent and malicious, for this, but in 2018, according to the Distil Networks 2019 Bad Bot Report, 37.9 percent of all internet traffic came from bots, with 20.4 percent being bad bots and 17.5 percent being good bots. This is reduced from previous years, however, so either bots are getting more efficient or measures against them are becoming more effective.
Social Media
- The number of active social media users, according to Backlinko, is 4.48 billion, showing there is still growth potential for social media if companies can find a proper reason to hook people in.
- According to the information shown here, people, at least people in the United States, are not necessarily increasing their social media use. People may have more accounts or be doing more on them in the same duration. but the amount of time spent isn’t going up. Many people are also quitting social media altogether, which is an interesting trend in and of itself.
Online Streaming and Usage
Online streaming in general has become of the most popular delivery methods of entertainment. Yet what is its relationship to people and what can we expect from it?
Here are a few facts to help:
- The live streaming market is estimated to reach about $247 billion in value by 2027
- Even on Facebook live video is more engaging. Live video receives 10 times the comments as non-live videos.
- Twitch has become the most popular live video streaming in terms of hours watched. Users spent 9.3 billion hours watching Twitch streams. And there are more than half a million active streamers. Of millennials, about 56 percent are most likely to watch live content on a smartphone.
- Businesses are using video content, whether live or not, much more often. It is generally used for company broadcasts. With the rise of remote work, we expect this to become commonplace.
Mobile Vs. Desktop Traffic
Something very important to note is that more people are using mobile devices to access the internet than ever before. While the desktop isn’t going anymore, the internet is adjusting to being more mobile, more adaptive, and sleeker than ever. Here are a few stats to demonstrate that:
- After just one year, the share of mobile users over desktop increased by just over 10%, a huge increase by any consideration.
- While the numbers vary a little by study, about half of global internet traffic occurs on mobile devices. In fact, many people around the world only access the internet through a mobile device.
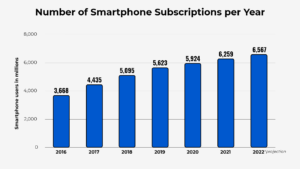
- There are more than 5.31 billion unique mobile users, and this number will grow.
- Companies and websites are now considering both mobile and desktop SEO, as the top keywords for each type of search and device can be different.
Smartphones and the Internet of Things
- According to information compiled by Hootsuite and We Are Social, the number of unique mobile users is higher than the number of standard internet users.
- We are still seeing steady growth in the smartphone market, although it might start to slow down due to market saturation. This might especially be the case in places such as the United States where most people already have a smartphone.
The Internet of things will be huge, and while numbers may vary, it can be expected that there will be more than 35.82 billion connected devices as of the end of 2021. This can include appliances, cars, wearables, smart home devices, machines for industrial purposes, smart city devices and technologies, and health care devices (and that’s just the tip of the iceberg).
Predictable Trends
While no one can predict technological or social development entirely accurately, based on the above and additional information, here are a few trends and expectations you should have moving in 2022 and beyond and be thinking about while reading further sections:
- In some ways, you can expect the expected: growth will continue, and while some specific aspects of the internet will grow or wane with the times, overall there’s still much to do and many new functions to be discovered, especially with further developments to the IoT.
- The main trend is toward that of more advanced online tools, algorithms, and ultimately a more sophisticated (yet likely more complicated on the back end) online experience for the user. Targeted ads will become more popular. Social media will seek to show you what you want to see (for better or worse) even more. More websites will interconnect.
- The other guarantee is that the unpredictable will happen. Major breakthroughs will occur in 2022 or soon, whether we realize them immediately or not. Political events will change usage habits and tech development on a national and international scale. And while we may try to factor such things in, ultimately there’s no perfect way to do so.
Working from Home
Having an office isn’t a requirement anymore. More people are working from home than ever, and online businesses using only remote workers is common practice. You may be already working from home or are thinking about making the switch soon. Yet why are people doing this, and what can we expect from the future of remote work? Here are some numbers to showcase the trends and tell you precisely what is happening:
Remote Work Numbers and the Trend Towards Freelancing
As we mentioned, remote work is getting more common. If there’s one takeaway from this section that you keep, please let it be that remote work is getting more popular, more practical and that it isn’t going away. Here’s the more precise breakdown: As we mentioned, remote work is getting more common. In fact, if there’s one takeaway from this section that you keep, please let it be that remote work is getting more popular, more practical and that it isn’t going away. Here’s the more precise breakdown:
- More than half of U.S. workers, as shown in the graphic above, work remotely at least once a month. The workplace is more mobile than ever, and the smartphone is key to this. It’s a key component to the modern workplace, with both more flexible hours and less clear work/life boundaries.
- Often paired with remote work is the rise of the freelance or “gig” economy, with rising rates of freelancers hoping to either make a living or earn some extra money. Via the Freelancing in America survey by Upwork and the Freelancer’s Union, 57 million people worked as freelancers in the United States in 2019, as opposed to 53 million in 2014.
- Betterment finds that one in three remote workers are freelancers, and cites Intuit stating that this number is at least 40 percent by this point.
- Perhaps more interestingly, 28 percent of people did full-time freelancing, while the same statistic was 17 percent in 2014. This is a staggering change over just more than half a decade, and it will be important to see how it will change in the coming years.
Remote Work Stats Employers Should Know
As the internet and the capability to work remotely with ease have become common, managers, executives, and hiring managers have had to come to terms with (or actively embrace) this new landscape. Here are some statistics that should get anyone in those positions (and many others) thinking:
- Owl Labs reports that small companies are twice as likely to hire remote workers. This could be due to a greater willingness to experiment with the previous norms and the reduced cost of remote workers (no need to pay for workstations and office space). It also allows small businesses to be more adaptive, and often be where customers need them to be more easily.
- There are similar reports with different numbers, but all of them state that remote workers are ultimately more productive than their non-remote counterparts. What’s telling is that in the Owl Labs survey it’s noted that “increased productivity/better focus” was the second most popular.
- Owl Labs also notes that 16 percent of companies exclusively hire remote workers. This is an astonishing number if you think about it, given the situation even twenty years ago. While this will never be the case for many industries, it can make one wonder what tasks can be delegated to a remote, more specialized, workforce.
- One in three employees would change their current job to work remotely, according to Gallup. Flexibility is more important than ever in a busy world, and this shows that there is a demand for change.
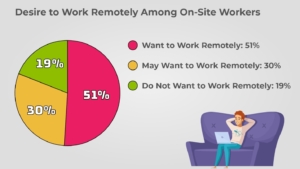
- Owl Labs backs this sentiment up. When they surveyed on-site workers, they found that 51 percent wanted to work remotely, 30 percent may want to, and 19 percent don’t want to. That wouldn’t leave a lot of people left in their offices if everyone got their way.
- In a staggering number from Owl Labs, 55 percent of remote workers stated they would probably look for another job if they were no longer allowed to work remotely. It shows that most people aren’t willing to accept that kind of change, and may also show managers that shifting someone to remote work is a weighty decision, as moving back is a rougher option.
- Alternatively, 61 percent of remote workers said they’d expect more pay if they could no longer do their work remotely.
- Owl Labs also reports that 34 percent of U.S. workers would take a five percent pay cut to be able to work remotely. This makes sense if you consider the costs (both time and monetary) that commuting brings to someone each day.
- A study also found that adding 20 minutes to your commute is as devastating as a 19 percent pay cut when it comes to employee happiness. Conversely, cutting out that commute via remote work may help employee retention rates.
- Flexjobs’ survey also noted that 30 percent of their respondents have left a job because it didn’t allow for flexible work opportunities. While the pool of people surveyed was likely to consider this important to begin with, flexible work will give companies the competitive edge in recruitment and retention, especially as more positions with the potential for remote work open in the future.
- Flexjobs noted that 97 percent of workers said that a flexible job would result in a huge improvement in their quality of life, showcasing not only the desire for more flexibility in the workplace that the internet can provide but some of the stresses of the standard system.
- According to Owl Labs, remote workers are 29 percent more likely to state that they are happy with their job.
Who Is a Remote Worker, and Why Are They Happier?
Now we should take a look at the remote workers themselves, what their preferences and opinions are, in general, who they are, and statistics surrounding the benefits of being a remote worker.
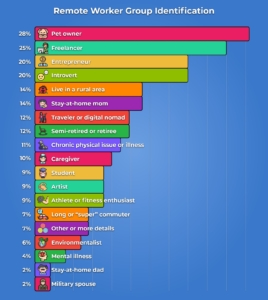
Naturally, being such a large group, remote workers have many backgrounds and many goals. According to the Flexjobs 2019 annual survey, remote workers identify strongly with the following groups of people:
You probably see yourself in this list, whether you’re an employee or employer, and cyberspace is making the previously unable to work now able to make a living for themselves and contribute more to the economy. It’s also allowing employers to consider previously unavailable but otherwise qualified people for positions.
Now let’s look at the benefits for a while, and review as best we can what is making remote workers more satisfied:
- According to Flexjobs, 78 percent of people state that a more flexible job would allow them to live a healthier life, and 86 percent stated they would be able to live a less stressed life.
- Relating to this, it is nearly common knowledge that, all else being equal, a less stressed and healthier individual is also by far a more productive one.
- Most remote workers have both traveled and worked remotely at the same time. This isn’t a new concept, and there are even professional “digital nomads” who never stay in the same place for too long. The internet has allowed even the most adventurous of spirits to hold down something resembling a permanent position.
- According to the State of Telecommuting, people who do even half their work remotely save on average 11 days each year from commuting. What can you do with that time? Who could you spend it with? What could you learn? Work utilizing the connective abilities of the Internet, all other things equal, might be able to save you months of your life over the next decade.
- The average commute in America is as of 2018 just a bit over 27 minutes, and it rose from previous years. This only serves as a strong pressure for people to consider remote work or push for it in their workplace.
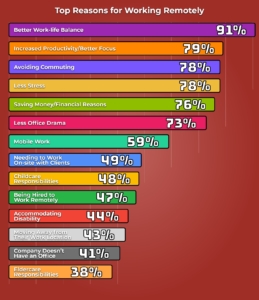
- Based on the Owl Labs 2019 remote work survey, respondents stated that the following reasons were the top reasons they worked remotely:
These reasons ultimately come down into one of several categories:
- People hope to get an improved quality of life and quality of work by working remotely.
- People hoping to save time or money by cutting out commuting and associated costs.
- People who have responsibilities for others that would prevent them from taking a standard on-site job, or who have a disability preventing them from working outside of the home.
- People who need to stay on the move or would like to, and those who have a position that was meant to be remote from the get-go.
These aren’t the only reasons, but they are the most prominent, and the internet is allowing people to congregate, collect data like this, and more easily make changes in their life.
Most Used Websites
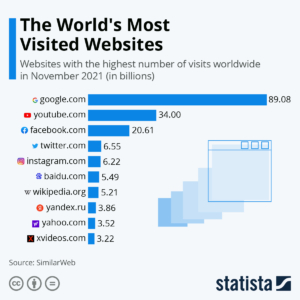
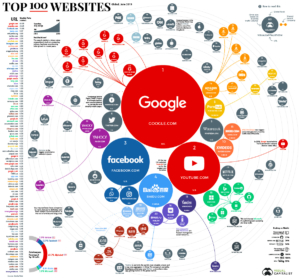
Looking at the most-used websites online can help us reflect on both how people use the internet now and how it might be used in the future. Here are the most used websites of the last year:
This is only the tip of the iceberg, and you may not even think of the above as websites due to their uniquity in everyday online life. So, to at least give you a hint as to what people use the internet for, here are the top 100 websites broken down by main purpose or site type.
A few clear trends are looking at these sites that we can surmise based on the results:
- Wikipedia and other types of wikis remain extremely popular across the world. Reference sites are not always thought of, but
- Some adult websites are popular, but on a worldwide scale, they’re overshadowed by nearly every other category. There has been an increase in usage in the last year, however.
- Ecommerce is growing as you might expect, and take up a healthy amount of the top 100 spots.
- There are always several social media sites on this list, although what might be interesting is which ones. We expect the number of social media sites to stay the same, but as people move on, the specific sites will change rapidly outside of a few mainstays.
- While video streaming is a popular activity, it mostly revolves around a few main sites (that can host that much content) instead of a widespread of smaller sites.
- Major tech companies like to have a web presence, and their investments generally pay off, as one might expect.
Different Countries, Different Metrics:
Another trend that we consider vital to the idea is that, in some ways, there is more than one internet. While websites used by the Western world remain somewhat consistent, China, through its more restrictive policies regarding the internet, has an entirely different set of metrics and sites to keep track of, and we don’t always have access to that data, or access with the assurance that it’s accurate.
Whether this may be the case for other countries or geographical regions may vary based on how the governments operate. For example, the North Korean government heavily restricts the internet (to people who have access in the first place) to only a very limited series of websites. In less extreme cases, we might have the full information about the most popular sites.
Internet Penetration by Country
More people are coming online, and it’s not just adoption rates in modern countries. Through cheap access and general proliferation, more people all over the world, regardless of country, are getting access to the internet in one form or another.
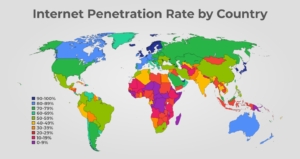
You can use these graphics to give yourself a better idea of how internet penetration is developing, based on information from Internet World Stats:
Let’s break down the above information a bit:
- Asia was the biggest growth market for some time, although now people should turn towards Africa as the proliferation of more affordable internet-connected devices in developed African countries is increasing massively.
- The United States, while certainly one of the most advanced countries in terms of access to technology, does not even make the top 25 when it comes to internet penetration rates.
- With the right infrastructure and drive, nothing is stopping many countries from reaching a high penetration rate within a decade or even five years.
- There are already quite a few countries that have a penetration rate above 95 percent, which likely means there’s little growth left to do in those areas, at least until satellite internet becomes widely and cheaply available.
- Alternatively, efforts might focus instead on providing better and more reliable infrastructure.
- In addition to averages, it might also be good to note that the rural/urban divide in some countries is quite noticeable, and internet penetration can often occur in pockets of complete coverage in some areas major cities) with neglect elsewhere.
Also, due to the nature of global data, we would like to express the fact that while the data is as current as possible, not all countries make the data available, and in some cases, the rate might be a year or two behind the rest.
Online Commerce
A source of economic prosperity for many, online commerce is the future, the origin of many jobs, and an opportunity that happens less than perhaps once in a lifetime. Based on some of the trends and statistics we talked about earlier, you can probably surmise that certain areas are booming in eCommerce. But don’t just take our word for it, consider these numbers and notice the trends compared to years past.
Here are the main items to know regarding online commerce as we move properly into 2022:
How Big Is eCommerce?
- eCommerce was responsible for 13 percent of total global retail sales in Q3 2021. Keep in mind this also includes areas that don’t have internet access, effective and reliable shipping infrastructure, or a population acclimated to online life.
- While we are still waiting for some exact percentage data for 2022, we can say that eCommerce saw huge growth overall, and is predicted to grow to $5.4 trillion in revenue for 2022.
- Surprisingly, in the United States, perhaps because of a more built infrastructure for in-person retail shopping or other trends in the information gathering, the total eCommerce as part of total retail sales percentage is about average. It was 14.3 percent in 2018 according to the U.S. Commerce Department, although over the last decade this trend has increased.
- About 91 percent of retail brands use two (or more) social media accounts, likely hoping to connect with people where they are.
- Amazon has previously dominated the online retail space, massive as it is, and it will continue to do so. According to eMarketer, Amazon was responsible for 48 percent of total retail eCommerce sales in 2018, with the next few options far behind.
- Amazon states that it controls about 4 percent of total United States retail spending.
- Yet it should be noted that Amazon is also an interesting platform, as it acts at once as a retailer for common items (and provider of many, many other services) and as a platform to enable third-party sellers to reach their customers.
Changing the Way We Shop
- As an example of the internet truly affecting the way the physical commercial world operates, sixty-five percent of customers will look up price comparisons while they’re in a physical store. Price matching has worked for some retailers, but ultimately the online competition will always be able to undercut them, so we’re likely to see continued shifts until we reach a new equilibrium (if that’s even possible).
- Most people who visit an eCommerce store don’t buy anything. Only 2.58 percent of eCommerce website visits resulted in any sales in Q2 2019. For comparison, Q4 2018 had a conversion rate of 3.23 percent (and that’s during the holiday season)
Imagine for a second that is the case for your local supermarket or retail chain. And while websites might try and improve conversion rates and create a more personalized experience for users, the ultimate truth is that browsing has never been easier and comparison shopping is the norm.
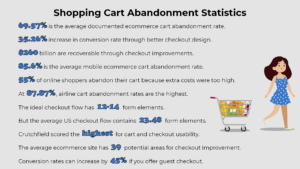
- To drive the analogy further, imagine that 69.57 percent of all carts</a> in the supermarket were abandoned with goods left in them. That’s the current online cart abandonment rate eCommerce sites have to contend with. The pressure to increase the conversion rate is ever-present.
However, brand loyalty is still a factor online. People are 30 percent more likely to return to a site they’ve shopped on before.
- No matter what other methods, tricks, or strategies businesses large and small might try, word of mouth and a good reputation are still the key factors for brands looking for success.
- Hubspot found that 81 percent of consumers in 2018 trusted the advice of friends and family over the advice of a business. 71 percent of consumers don’t trust social media ads, and 65 percent don’t trust company press releases. These numbers could and do vary from company to company, but the anti-business sentiment will be a thing to keep watch on in 2022.
Virtual Learning and Usage
Whether by children going to school virtually because of the pandemic or people trying out online classes having not much else to do in their spare time, virtual learning saw a major boom in the last year. It’s one of the trends of the last year most worth talking about. Here are some stats about the trend, divided into two sub-topics:
Classroom Internet Usage
- In 2020, about 98 percent of universities</a> moved classes online out of necessity, changing the idea of the classroom forever.
- About 75 percent of schools plan to operate online in 2021. With how the pandemic ebbs and flows, this number could be much higher or lower when all is said and done.
- Before the pandemic, about 57 percent of schools used digital tools or learning of some kind.
- However, virtual learning or eLearning isn’t always so popular. Only 48 percent of undergraduate students thought online learning was as effective as in-person learning.
- Additionally, across the board, more students receive lower or failing marks in their online classes than if they were in person.
Phone Apps and Usage for Learning
Phones and apps are available for use anywhere, widely distributed, and often optimized for the quick transmission of information. This makes them perfect for learning in many regards. Yet what do we know about these apps and their trends so far?
- The industry of eLearning as a whole is expected to grow to more than $243 billion by next year.
- The vast majority of eLearning and app usage still occurs in Western countries, but we expect this to change over time.
- On the App Store and Google Play, Education apps are a popular category, with the apps being about nine percent of the total.
- While there are plenty of supplemental apps, Google Classroom is the main app used last year to help kids learn. The other popular apps remained mostly unchanged from previous years, and seemingly unrelated to classroom efforts.
Conclusion
In some ways, this is only the start if you’re seeking to truly understand everything about the Internet in 2022. There is a wealth of further information out there, and if you were to check our sources for even further context you could find that there’s a lot more left to learn. That being said, we hope that you will be able to use this information to the fullest and that your curiosity is sparked.
Source: Originally seen on Internet Advisor.

